[Note to reader: the active link to the solar flare video has been restored] This Spring has been pretty exciting for solar activity…Following the ending of the longest-running solar minimum (of sun spots) in more than a century, our sun’s activity (solar cycle 24) has picked up considerably over the course of the month of May, culminating in an M-2 class (medium size) solar flare and “spectacular” mass coronal ejection (MCE) on June 7.
Solar flares sporadically erupt from the surface of the sun, often following the growth of sun spot pairs in that area. A Coronal Mass Ejection (CME) occurs as the sun’s atmosphere (its corona) is violently and rapidly “cast off” — shooting a massive wave of solar particles and plasma millions of miles into space. Large solar flares can trigger a CME.
[correction, June 13] While it takes light from the sun just over 8 minutes to reach Earth, particles from a CME (carried on the “solar wind”), traveling slower than light, would take an estimated 45 minutes hours to reach Earth. (note: the speed of light was used to calculate the timing of CME solar particles reaching the Earth, this was an error, as said particles do not travel at the speed of light, but the equivalent of between 1 and 2 million mph, or, between 400 and 800 km/sec)
If you’re into this, you’ll probably also love –>> Dude, Surfs Up on the Sun – Classic ‘Surfer’ Waves Seen in Solar Atmosphere [VIDEO]
For a medium-sized solar event, its effect was pretty impressive, and massive, as a huge explosion of solar particles erupted from the surface of the sun and fell back “looking as if it covered an area of almost half the solar surface” according to the NASA site that tracks solar dynamics. That’s pretty impressive for just a “medium-sized” flare.
The video (below) of the flare and CME were recorded by NASA’s Solar Dynamics Observatory (SDO), launched in Feb. of 2010. SDO’s camera recorded the event in extreme, ultra-violet light — revealing the large eruption to be composed of an extremely “cool gas” (relative to the sun’s coronal temperature, that is).
Watch the SDO video of the solar flare
There are five, sun-monitoring probes (including STEREO, a pair of solar probes, and the HINODE probe, a joint mission by NASA and JAXA, Japan’s space agency) currently in operation. All of the Heliophysics System Observatory missions captured the event.
Here’s a look (.gif animation) at the solar corona taken by the SOHO (Solar and Heliospheric Observatory) probe, and showing bright plasma and high-energy particles roaring from the Sun during the CME:
More about Sun spot cycle 24:
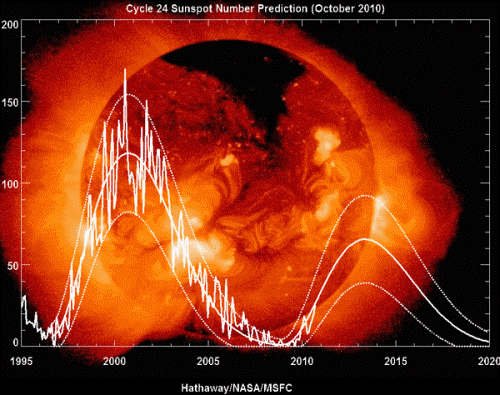
Although solar cycle 24 is picking up in terms of activity, it is still predicted that the next solar maximum (i.e., maximum number of sun spots), peaking in 2013, will be rather low by historical standards.
According to the Marshall Space Flight Center:
“The current prediction for Sunspot Cycle 24 gives a smoothed sunspot number maximum of about 69 in June of 2013. We are currently over two and a half years into Cycle 24. Three consecutive months with average daily sunspot numbers above 40 has raised the predicted maximum above the 64.2 for the Cycle 14 maximum in 1907. The predicted size would make this the smallest sunspot cycle in over 100 years.”
Here’s an chart of the predicted number of sun spots for cycle 24:
Note (from the MSFC website): These predictions are for “smoothed” International Sunspot Numbers. The smoothing is usually over time periods of about a year or more so both the daily and the monthly values for the International Sunspot Number should fluctuate about our predicted numbers. The dotted lines on the prediction plots indicate the expected range of the monthly sunspot numbers. Also note that the “Boulder” numbers reported daily at www.spaceweather.com are typically about 35% higher than the International sunspot number.
Want more solar news? Check out my next article on “surfer waves” recently discovered in the sun’s corona.


I m very intersted to read more about the sunspots and how its affecting the Earth and what civilization can do to prevent damage to the things on the Earth and ourselves besides just sunblock.
Thanks for you comment Richard.
The role sunspots play in solar activity (flares, CMEs) is there, but somewhat indirect; there is a strong correlation between the size and number of sunspots and the eruption of flares (and large ones too). Do sunspots directly cause flares (and then CMEs)? Or, do they reflect dynamic conditions within or on the sun that ultimately lead to flares, etc.?
These events contribute to the solar wind which bathes our planet in charged particles. This increase in solar radiation does have an impact on our atmosphere and climate, but the effects are modified by many conditions (of the atmosphere and surface) and variables (like aerosols and cloud cover) here on Earth. And, the cumulative (mid to long-term) impact of this increase in solar radiation on our climate is modified by the larger-time-scale Milankovitch cycles.
Solar physicists are working on a ‘Sun to Mud’ model that one day, may explain the inter-relationships between all these factors and forces, and thus give us an understanding of how (andhow much) sun spot activity truly impacts Earth’s climate system.
Nice, informative, with good links to other URLs. Permit me one correction however. My apology in advance if this digresses a bit or is too “basic”. The flow of particles (atoms & ions) from the suns corona is called the “solar wind”. The typical speed of the solar wind is about 400 km / sec; which is about one million miles an hour, give or take. Although it is always directed away from the Sun, it changes speed and density. A CME is a massive “blast” of solar wind that travels faster than that. Even if it were 800 km/s it would still be “only” 2 million mph – a respectable speed, but not an appreciable fraction of c, the speed of light. At 2 million mph and distance to earth of 93,000,000,000 miles it would take 46.5 hours to get here.
fc> 93,000,000,000 miles
Oops sorry, I meant 93,000,000 miles. The time delay is right though.
Frank
Hi Frank, thanks for the comment and correction (post has a correction in it as of 11:00am PST, June 13, 2011 + again on June 18, 3:15pm).
I reflexively used the speed of light as a time-gauge, instead of the estimated speed of CME “solar wind” particles (which has been measured to a range of speeds). In my original draft, I used the term solar wind, and then deleted it in the final. My understanding, though, of the ‘solar wind’ is that it is continuous (though varying in strength), with or without a CME; a CME making the wind stronger, in terms of energetic particles.
Also: my understanding of the solar wind is that it is comprised of highly energetic particles, some of which are photons, which, being the quantum of light (electromagnetic energy), do indeed travel at the speed of light. So, it would seem that some components of the wind get here faster than others. It would be interesting to see a breakdown of solar wind particles and speeds.
Anyone out there with knowledge of this?
If, as you stated, it takes approximately 7 minutes for the CME to reach Earth, it would have to be traveling faster than light.
Hi Vern, thanks for the correction of my back-of-an-envelope estimation…I was using an average distance of 93 million miles from the sun to the Earth and rounded up the speed of light to 190,000 miles per second, giving me a quick figure of 7 minutes and several seconds + (for which I wrote “approximately”)….which is actually not far off from the “official” estimate of 8 minutes and 20 seconds (from the Universe Today site)…while its true that the speed of light doesn’t change (but gets more accurate as our measurements improve), the distance from the sun to the Earth DOES change, so, the final figure (if one were to be more exact) actually will change/fluctuate between 7 minutes (and a few seconds) to 8 minutes and 30 seconds. [see later comments for a CORRECTION of this item in the original post]
How does the solar cycle effect our weather -if at all?
Thanks for commenting, Nick.
How space weather impacts Earth weather is THE question here. Solar flare/CME events would seem to impact us indirectly, through increasing insolation, temporarily, which, depending on ozone layer thickness, could then impact oceanic warming (especially in the North where albedo is declining), and inhibiting to some degree the oceanic carbon pump…but any such impacts would also be mitigated (long-term) by Milankovitch cycles.
The eccentricity and axial tilt cycles, then, would be the M cycles to watch (as precession still favors glaciation or cooling), according to my source at GSFC. I would definitely visit the Goddard Center website…and I have found the folks there to be very helpful with public information.