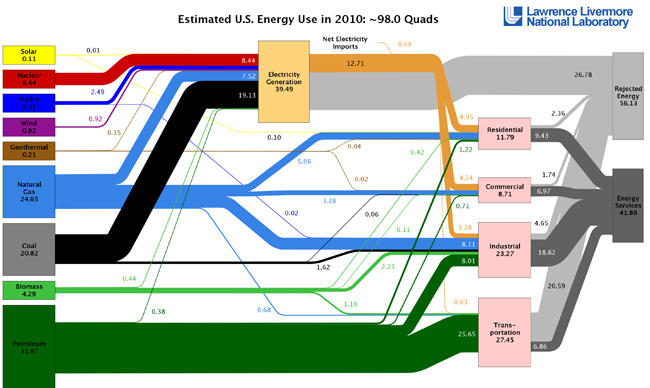
According to statistics compiled by the Lawrence Livermore National Laboratory, American energy usage and fossil fuel usage started climbing again in 2010 after it had been decreased to a 12-year low the year before.
In a press release full of statistics and lessons learned from the latest flow chart produced by the LLNL, it was clear that after a drop, Americans may have forgotten how to conserve energy.
Wind power was one bright spot, increasing its production of energy from .70 quadrillion BTU, or quads, in 2009 to .92 quads in 2010.
“We are still seeing the capacity additions from a wind energy boom come online,” said. A.J. Simon, an LLNL energy systems analyst who develops the flow charts using data provided by the Department of Energy’s Energy Information Administration. “And renewable fuel mandates are driving the consumption of ethanol by cars and trucks.”
Concerning ethanol, biomass energy consumption rose from 3.88 quads to 4.29 quads, a process driven by the increasing use of ethanol as a transportation fuel and a feedstock for industrial production.
In the overall scheme of things, however, US Energy use comes in at 98 quadrillion BTU, up from 94.6 quads in 2009; unsurprisingly, most of this energy was linked to coal, natural gas and petroleum.
Breaking the 98 quads down, the majority was focused on generating electricity, followed by its use in transportation, industrial, residential, and commercial consumption.
“This is just a snapshot of how the energy system was used,” Simon said. “Although it doesn’t appear to change much from year-to-year, even small shifts can have big consequences for certain sectors of our economy.”
The major producer of electricity was coal, as it has been for some time now, with nuclear and natural gas coming in second and third respectively as energy producers.
However, natural gas consumption by the electric sector grew 0.5 quads in 2010, driven by consistently low natural gas prices, continuing a trend which has seen gas use in the electric sector rise by 25 percent.
Carbon emissions were higher for Americans in 2010, but still down from the all tie high in 2007. Here’s hoping that 2010 is just a blip on the radar and the downward trend continues for 2011.

