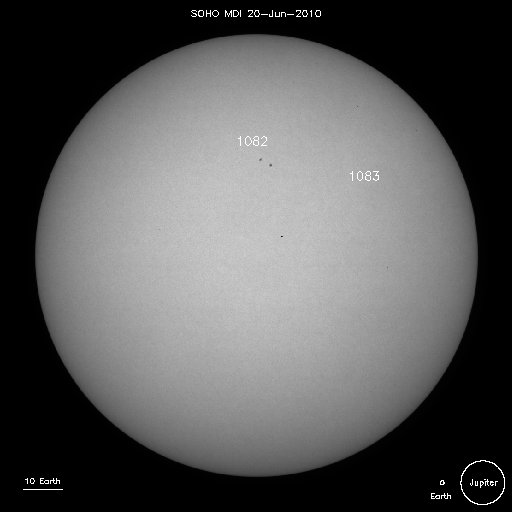
 Something unusual is not happening on the surface of our sun: dark patches, known as sunspots, seem to be missing.
These variously sized sunspots –frequently occurring in pairs–that regularly appear on our Sun’s surface have been tracked and recorded for over four centuries (since the time of Galileo and even earlier). It has long been observed that the comings and goings of such spots occur generally over an eleven year period, oscillating between a “solar minimum” (a low sunspot activity phase) and a “solar maximum” (a high sunspot activity phase).
Technically, we should have been seeing a transition out of a solar minimum and into a phase of more plentiful sunspot appearances, but, for the past two years there has been a virtual dearth of sunspot activity. This absence of sun spots is currently the subject of much discussion in the solar science community.
Our Sun is experiencing the most prolonged period of minimal sunspot activity in nearly a century. The puzzling absence of these spots, whose build-up commonly signals the occurrence of large solar storms and flares, has space scientists and solar physicists searching for explanations.
Sunspots are typically observed in pairs (though not always) which are oppositely charged and are believed to be the result of magnetic field lines escaping the sun’s surface and looping back to reconnect beneath the locus of the positively charged spot (although sometime this does not happen, or happens within a single, large spot). They appear dark due to the fact that this magnetic energy flow lowers the surface temperature at these spots.
Sunspot activity is a semi-proxy indicator of the Sun’s overall magnetic activity. Thus, speculation is mounting that the current absence of sunspots on the solar surface could mean that out sun’s magnetic activity is decreasing–or possibly even that the sun is shrinking.
Watch this real-time .gif movie of recent (May 15) solar activity recorded by NASA’s SOHO observatory (article continues below):
Click this link to view the.gif movie

The last solar minimum was in 2008, and so, sunspot activity was expected to be picking up by now. Computer modeling of solar dynamics predicted a return of sunspot activity in 2009 and 2010. So far, this is not being seen. It is as if the sun is having trouble “kick-starting” its newest sun spot cycle, and thus also, its magnetic dynamo that lies deep within it. For now, we appear to be in an extended solar minimum.*
Solar dynamics are also driven by the sun’s “conveyor belts”–one flowing within the sun and the other flowing across its surface–which transport gas and magnetic energy between the interior and surface (and out into space). Recent observations and calculations show that the sun’s surface conveyor is speeding up, while its internal conveyor is slowing down. Neither of these phenomena was predicted by current computer models; there appears to be some large piece of the solar puzzle still missing.
We are currently experiencing Solar Cycle 24 (the 24th such cycle to be officially observed/documented), and, according to solar physicists working with the Hinode solar observation mission, things are “heating up”, only slowly. No doubt, the sunspot cycle will start up again, eventually. But why this is happening–or not happening– is becoming quite the mystery.
Speculatively, a prolonged absence of sunspots may mean that when the sunspots do return, they may do so in greater numbers than in previously cycles. The resulting increase in solar activity–solar flares, storms and even MCEs (mass coronal ejections)–will likely produce major “solar particle events” (SPEs) that will disrupt communication satellites, GPS systems, cell phones, power grids and even possibly the functioning of the International Space Station.
There is also the question of how much this current minimum will impact the Earth’s climate. While there is obviously some relationship between solar activity and the Earth’s climate system (such as our precipitation cycles), the long term impact on the Earth’s climate from solar dynamics is a subject of much controversy, with more ‘unknowns’ than ‘knowns’.
 However, there is one well-documented historical example here: our sun went through a prolonged phase of sun spot inactivity–known as the Maunder Minimum– from 1645 through 1715 (see chart above). This period roughly corresponds to what has been called ” The Little Ice Age”, which greatly impacted much of Europe’s growing seasons and agricultural harvests for several decades.
In the meantime, the solar physics community is hard at work trying to determine what all this means. Currently, NASA, ESA (The European version of NASA) and JAXA (the Japanese national space agency) have a fleet of space-based observatories and instruments employed to keep tabs on solar dynamics. Three examples of these are the SOHO (ESA/NASA), Hinode (JAXA, Japan) and STEREO (NASA) missions.
* Special Note: This protracted solar minimum could be a “normal” variation in a much longer term solar state cycle–one cycling over centuries or even millennia. Many dynamic systems in Nature, though relatively periodic/predictable, experience variations in their state cycles of greater or lesser degrees, yet none-the-less remain stable over time. Our sun is most likely of this sort.
For more information on the Sunspot Cycle, visit the NASA site here.
For more up to date information and data on sunspots and other solar influences, visit the Solar Influences Data Analysis Center (SIDC)
photo (magnetograph of the solar surface, SOHO mission): NASA/ESA
chart: NASA
GIF movie courtesy of the LASCO/NRL SOHO team
This excerpt comes from a Dec. 15, 2010 Yahoo news item:
“The August 1st event really opened our eyes,” NASA scientist Karel Schrijver said. “We see that solar storms can be global events, playing out on scales we scarcely imagined before.”
Scientists are still trying to figure out what kind of connection there is among the massive explosions that occurred so far apart on the sun’s surface.
[Related: First ‘alien’ planet from another galaxy discovered]
“We’re still sorting out cause and effect,” Schrijver told the Daily Mail. “Was the event one big chain reaction, in which one eruption triggered another, bang, bang, bang, in sequence? Or did everything go off together as a consequence of some greater change in the sun’s global magnetic field?”
This ‘great eruption’ would seem to describe a solar phenomenon (or phenomena) not anticipated previously..and, it may also validate (to some extent) my ‘rebound theory’ as noted in the main article. Of course, things might well just calm back down to normal solar activity, but right now, “normal” is not a word being used by the solar physics crowd.
Hey–if this means we're going to cool off from these constant heat waves for a while–thank you.
Possibly a longer term cycle is over arching the 11 year one. Do we see evidence of the 70 year low of the mid 17 th century? In which case global cooling will occur. I have always felt that we are better to stress a clean planet rather than man-made global warming- fits all scenarios and who would argue?.
Mr Spooner:
You said "…very early and very strong, versus somewhat early and somewhat strong…." regarding two competing views between experts. Pardon me if I am misinterpreting, but the former view ("very strong") seems to imply a sunspot cycle greater than expected (whether frequency, size, etc–based upon past cycles, which is the comparative frame of reference here)….I agree that solar science is complex and we have only computer simulations to make predictions with, but in this theoretical prediction we see hints of (the inevitable) speculation…even scientists are not immune from this.
That said, I have found solar scientists and geophysicists (of which I have interviewed a few) to be amongst the MOST cautious of scientists–reflexively downplaying ANY hint of controversy or sensation.
Love them. Really.
Solar activity WAS picking up nicely until Feb/Mar, then dipped back again. We are low and late and well below the downgraded NASA predictions. I think it says something about the way scientific observations are viewed that scientists somehow "want" the activity to be higher! It is what it is, guys. Lets suppose for a minute there IS a correlation between sunspots and weather, and that, say, a fifty year period of low sunspots would cool the planet off? Surely that would be good, and would stop us from having to tax the bejeezus out of everything carbon – and yet, we still don't seem to be able to want it, to the point where NASA scientists and journos take every opportunity to claim the sunspots and flares will blast back with a vengeance just you wait.
"A delay or prolonged absence of sunspots may mean that when the sunspots do return, they will do so in far greater numbers than previously seen. The resulting solar activity–solar flares, storms and even MCEs (mass coronal ejections)– will likely produce major “solar particle events” (SPEs) that will disrupt communication satellites, GPS systems, cell phones, power grids and even possibly the functioning of the International Space Station."
My prediction:
A late maximum of around 60 average peak sunspot numbers in 2014. Effect on planet: Things a tad cooler.
The previous minimum was 1996, not 2004.
When solar scientists began debating the course of Cycle 24, the dispute between Hathaway and Dikpati was between very early and very strong, versus somewhat early and somewhat strong. That gave way twice until the last "official" prediction was made just over a year ago. That prediction in turn is proving to be too strong and maybe too early. It's now impossible to state scientifically when the minimum is taking place because it's an arbitrary smoothed period and the raw data went essentially flat for a very long time.
I've read dozens of opinions about the future trends in sunspot activity and not only has no one propounded your "rebound" theory, nobody has suggested that this may be an alternative. And, yes, you used the word "may," but you followed it with "likely," which is a stretch.
I read about this in a copy of New Scientist in the library this morning and I have been wondering about it all day off and on. So I was glad to read more here. There's probably nothing at all we can do about it. We'll just have to grin and bear it. Another mini-ice age is possibly on the cards. That's great news for polar bears but I wonder what will it mean for the rest of us if it comes about, apart from more ice fairs on the Thames. On the other hand it might be that this is another mini cycle of some sort and that the spots will duly reappear as usual 9 years from now. I wouldn't see it as any cause for alarm.
It looks like the sun has been picking up for months now according to spaceweather.com. But hey, let's play the grand mysterious solar minimum just a little longer – nobody will notice! I'll admit the theoretical link to a little ice age is a blast when it comes to terrifying the masses, and it drives the warming alarmists nuts. Not to worry about running out of copy though – once the sun does comes back, there's plenty of mileage to be had writing about civilization-ending solar storms.
Note to reader: the original post incorrectly identified 2007 as the "last solar minimum" (a date that was taken from a NASA site, actually). That date has been corrected to 2008 (the previous minimum being in 1996; also corrected).
The commenter's statement that : "Even the reduced predictions from last year are proving to be too high" clearly indicates that scientists adjusted their numbers downward…and yet you suggest that high activity was not predicted, or anticipated…based upon these current trends, I would say that this statement is unclear or misleading. If estimates are reduced, and outcomes are lower than expected, then naturally, one is going to anticipate some sort of "rebound" in sunspot activity (to at least normal levels)–even if there is no evidence at hand…this is a natural speculation based upon unexpected, low sunspot activity and our knowledge of past cyclic activity.
Thank you to my earnest readers for catching a few dating errors, and also for indulging my bit of controversial conjecture (blog publishers love controversy!)
As to the possibility of greater sunspot activity in the future, this is not, or was not, a "conclusion"–I used the term "may lead"—but speculation; this has been predicted, or anticipated, by others. Not all solar scientists agree, of course.
Further, you certainly are not privy to every opinion in the solar physics community.
As you noted: "Solar scientists simply have no ability to predict future solar activity."…so, Your 'green cheese" comment is pointless (except to insult)–given my obvious use of the word "may"…
Skepticism in regards to scientific (general public) news stories is a good thing, in general (’cause we can over-reach from time to time), but reactionary dismissals tend not to further any discussion; they only shut it down, and may reinforce peoples' views of arrogant (dismissive) scientists.
I do respect and appreciate what scientist do, however (even the arrogant ones), and I appreciate their comments here.
That said, I am not trying to lend more tinder to the 2012 apocalypse bonfire, and my apologies if I have seemed to do so here. I’ve been following sunspots since I was 8 years old (1970), when I received my first refracting telescope complete with sun-viewing attachment panels).
Yes, the current lack of sunspots could lead to a greater number later. The moon could be made out of green cheese, just below all that rock we've encountered. Anything is possible. But there is not the slightest evidence, not a scintilla, not an iota, to support this conclusion. Every scientific opinion says that a delay is more likely to result in a lower peak.
The minimum was not in 2007, and low activity in 2008 (when the minimum eventually did occur in December) was not predicted. Even the reduced predictions from last year are proving to be too high. Solar scientists simply have no ability to predict future solar activity, apart from noticing the general cycle that is roughly eleven years except when it isn't.